 1926HURRICANE.COM
Track methodology
The interactive atlas uses the 46 official HURDAT2 fixes for AL071926, including the 2200 UTC Gulf Coast landfall fix as its centerline. Those fixes are a modern best-track reconstruction assembled from historical observations and later NOAA reanalysis; they are not a literal copy of a map drawn in 1926.
The National Hurricane Center describes HURDAT2 as the official Atlantic hurricane database, with six-hourly position and intensity information. NOAA's reanalysis project revisits historical storms using additional observations and modern analysis methods. For the Great Miami Hurricane, the current U.S. landfall table gives the South Florida landfall at 1200 UTC September 18, 1926, 125 kt (145 mph), Category 4, 930 mb, with a 20-nautical-mile radius of maximum wind.
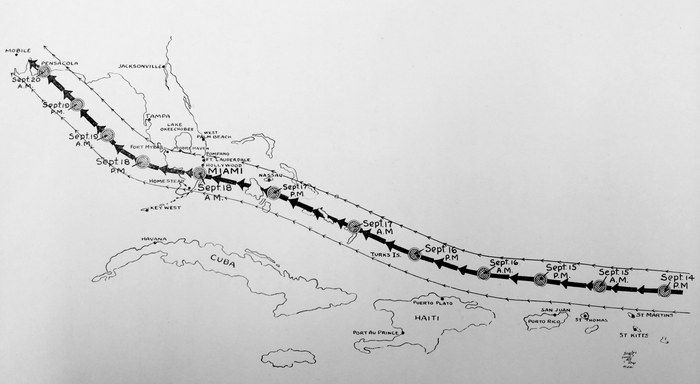
The 1926 route diagram is now identified.
The hand-drawn route diagram in this archive was published in Florida's Great Hurricane by Joe Hugh Reese in 1926, published in Miami by Lysle E. Fesler. Its original caption states that the sketch was drawn under the direction of Richard W. Gray, meteorologist in charge of the Miami office of the U.S. Weather Bureau. The circles show the storm's progress at roughly twelve-hour intervals from September 14 through September 20.
That makes the diagram a valuable contemporary interpretive track, but not an interchangeable substitute for HURDAT2. The historical diagram reflects what could be reconstructed and communicated soon after the disaster; HURDAT2 incorporates later reanalysis and additional evidence.
How positions and landfalls are handled.
Official fix: a HURDAT2 position shown exactly from the modern best-track dataset. Landfall: NOAA's detailed U.S. hurricane-impact table can provide a landfall time and location that falls between six-hour fixes. Local observation: Weather Bureau, ship, pressure, wind, eye-passage and storm-tide reports are plotted as evidence points, not silently converted into center fixes. Motion: map motion is derived from adjacent official fixes and is labeled as derived.
IBTrACS is used only as a cross-check. It exposes HURDAT2-derived information and interpolated three-hour positions; those interpolated positions are not added to the website's 46-point official plotbook.
Why the center passes south of downtown Miami
NOAA’s reanalysis places the September 18 landfall center at 25.6° N, 80.3° W and records the eye passing over the Miami Weather Bureau office. The eye covers an area; an observer can be inside it without being on the centerline. The atlas preserves the official position rather than shifting it to the city label.
The dashed landfall circle shows NOAA’s 20-nautical-mile radius of maximum wind (about 23 statute miles). It is not the eye boundary or the outer extent of hurricane winds. The source does not supply a measured eye diameter, so no eye outline is drawn.
NOAA reanalysis: Miami observations and landfall parameters ↗
Historical uncertainty remains visible.
Observations over the central Atlantic were sparse, and many intensity estimates were reconstructed after the fact. The atlas therefore separates observed station/ship evidence from the analyzed storm center, preserves missing fields rather than inventing values, and identifies modeled wind swaths separately from both observations and best-track positions.
Return to the interactive Storm Atlas · Scientific source lineage
The science is modern; the event is historical.
This site uses modern hurricane terminology to make the reconstructed storm understandable, but those labels were not all available to forecasters or the public in 1926. The Saffir-Simpson scale was developed in the early 1970s, so “Category 4” is a retrospective shorthand for the hurricane’s reconstructed wind intensity. Likewise, today’s best-track positions and wind values are products of later HURDAT reanalysis, not a continuous real-time map that existed during the storm.
When a historical source gives a barometer reading, a local wind observation or a warning time, the archive preserves that observation as evidence from a particular place and moment. When this site gives a storm-center position, maximum sustained wind, RMW or category, it identifies the modern reconstruction separately.
NOAA/AOML history of the Saffir-Simpson scale ↗ · NOAA/AOML 1926–1930 reanalysis metadata ↗