1926HURRICANE.COM
The weak disturbance crossed west-central Cuba, described by the contemporary Monthly Weather Review as being of slight intensity.
Miami, hour by hour
Richard W. Gray’s notes preserve the pressure fall, warning decisions and instrument failures inside Miami’s downtown Weather Bureau office.
Time standard: every time below is 75th-meridian standard time—the local standard time used in Miami in 1926 (UTC−5). Only times stated in Gray’s record or the National Weather Service warning history are shown; missing hourly observations are not invented.
The ground was already wet.
The Great Miami Hurricane did not approach a dry landscape. A separate unnamed tropical cyclone—cataloged in the modern NOAA reanalysis as 1926 Storm 6—crossed Cuba, briefly became a minimal tropical storm near the Bahamas, turned west through the Florida Straits and weakened to a depression on September 17. NOAA’s reconstruction says it did not produce tropical-storm-force conditions in southeast Florida, but its moisture coincided with intense local rain and existing Everglades overflow.
The system strengthened near the Bahamas, then was forced westward through the Florida Straits.
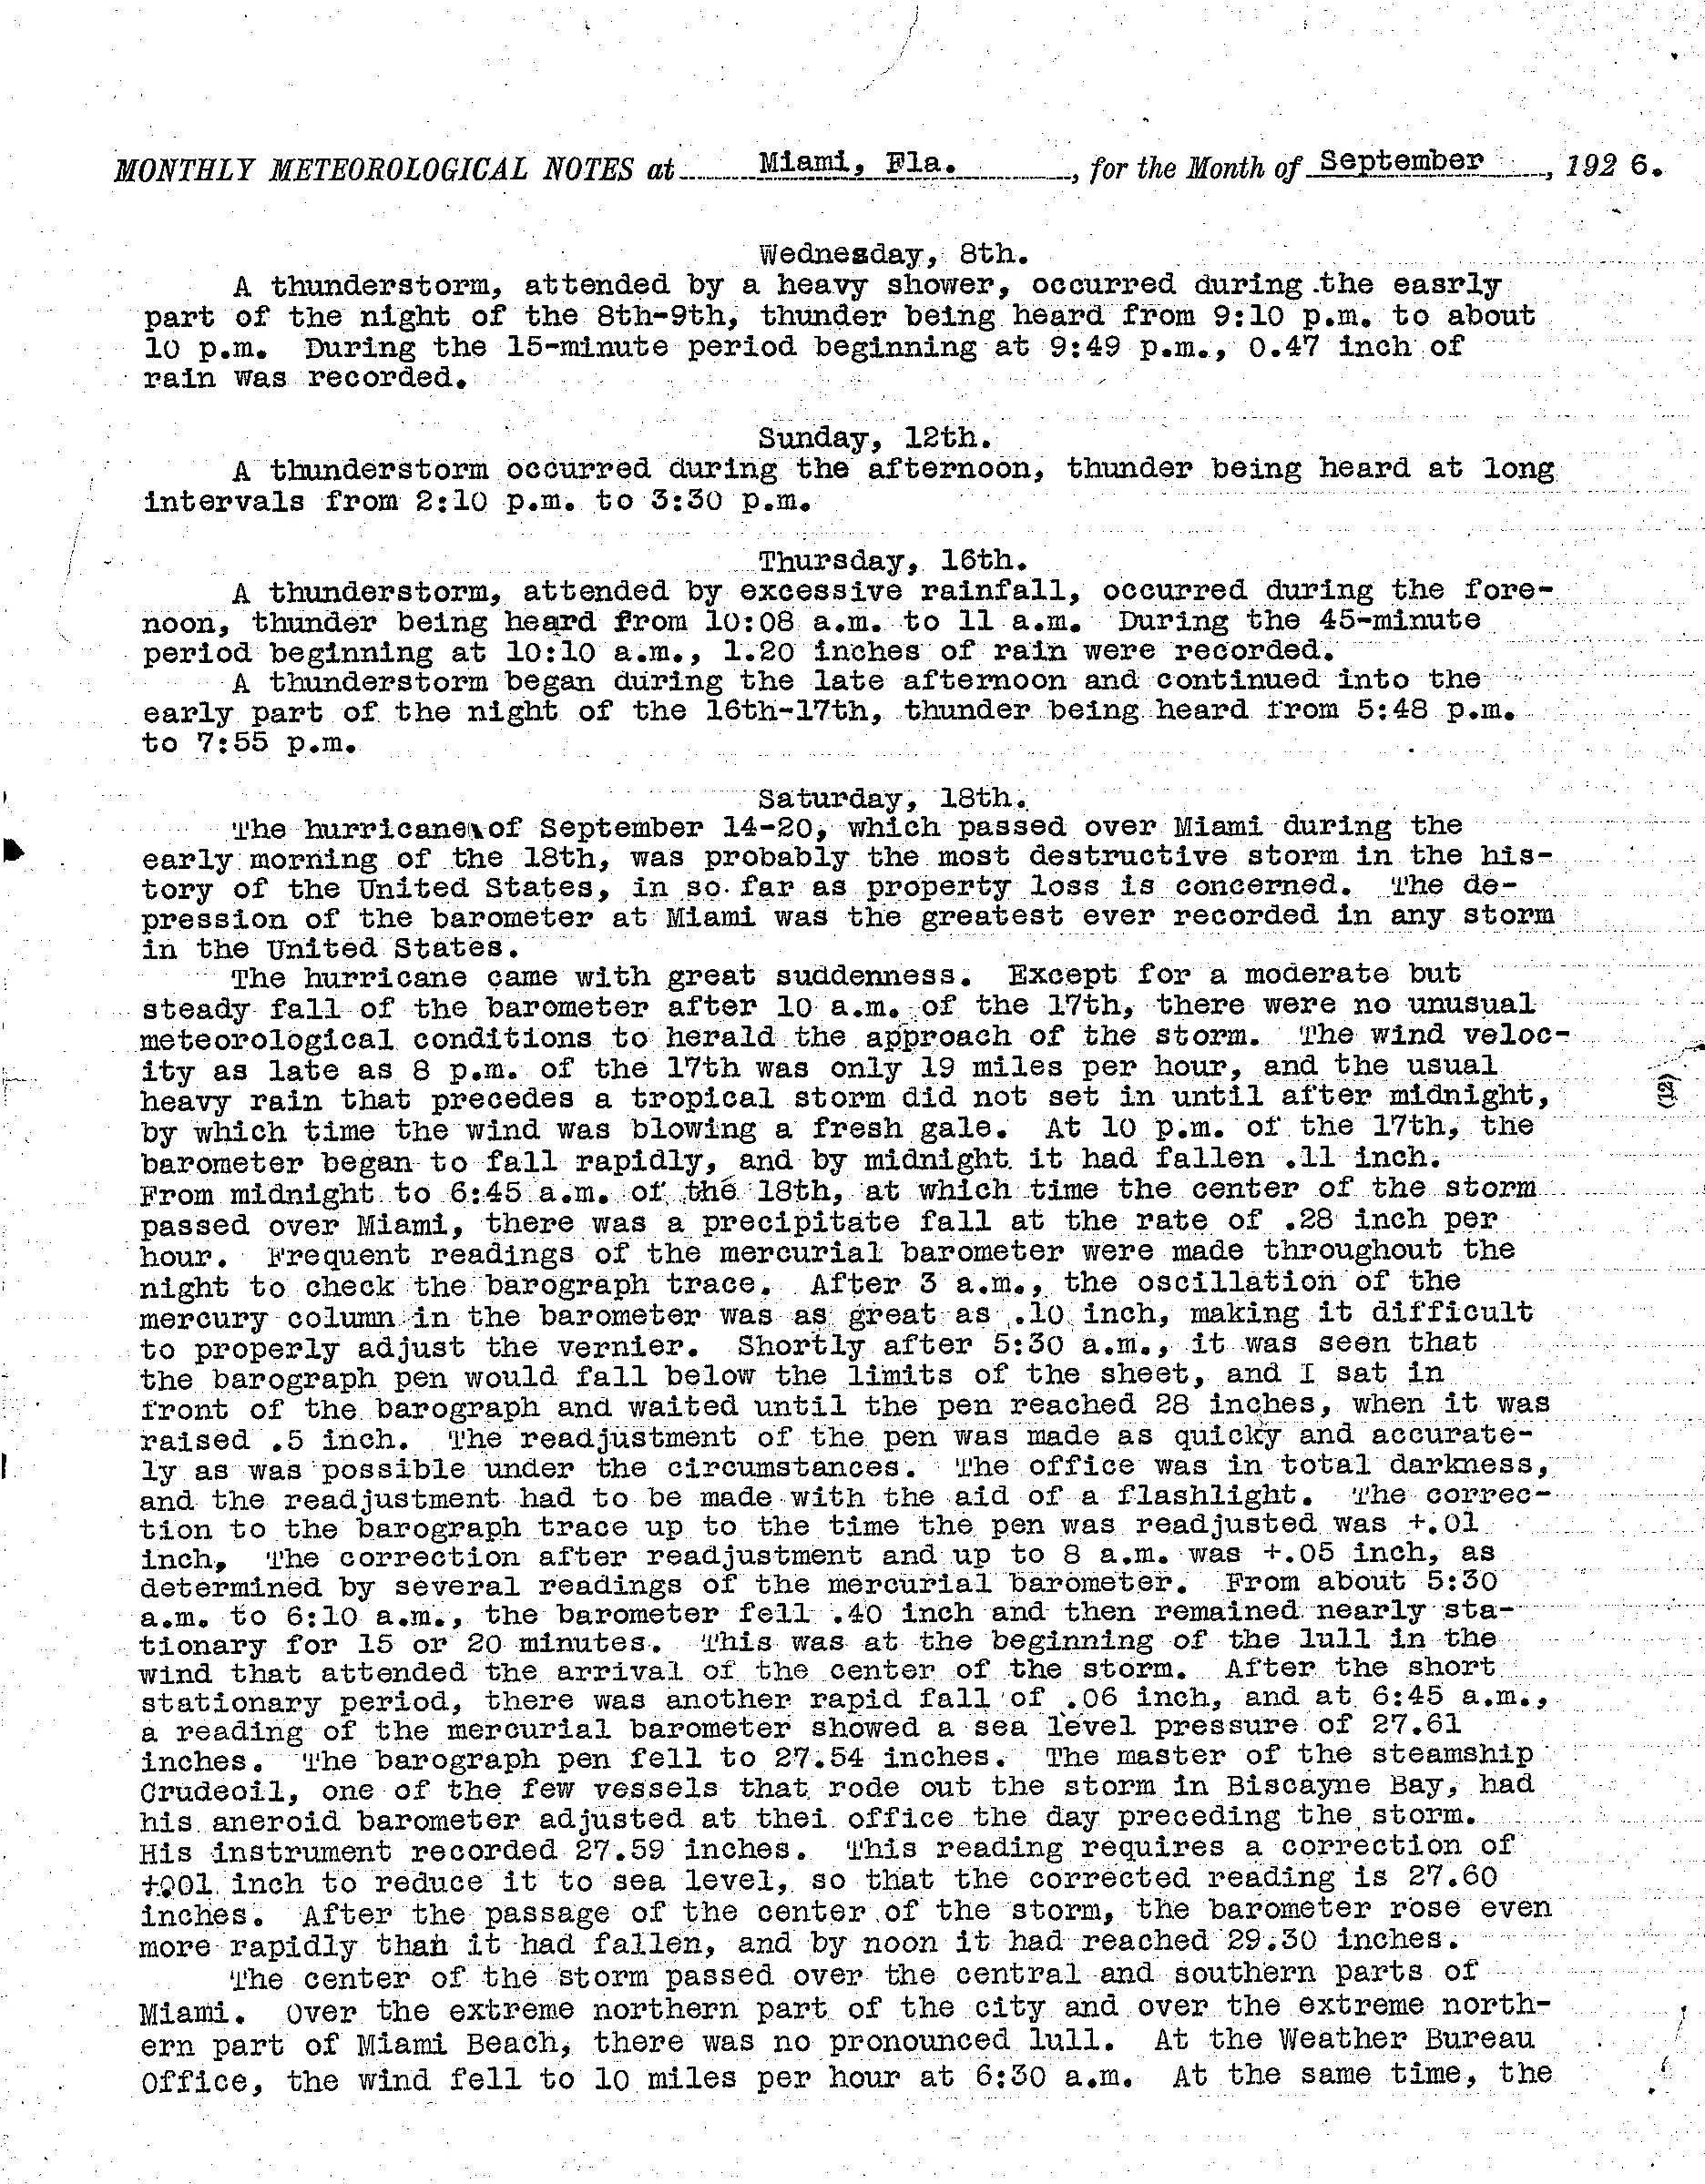
Gray’s Miami station notes call the rainfall “excessive.” A second thunderstorm followed from late afternoon into the evening.
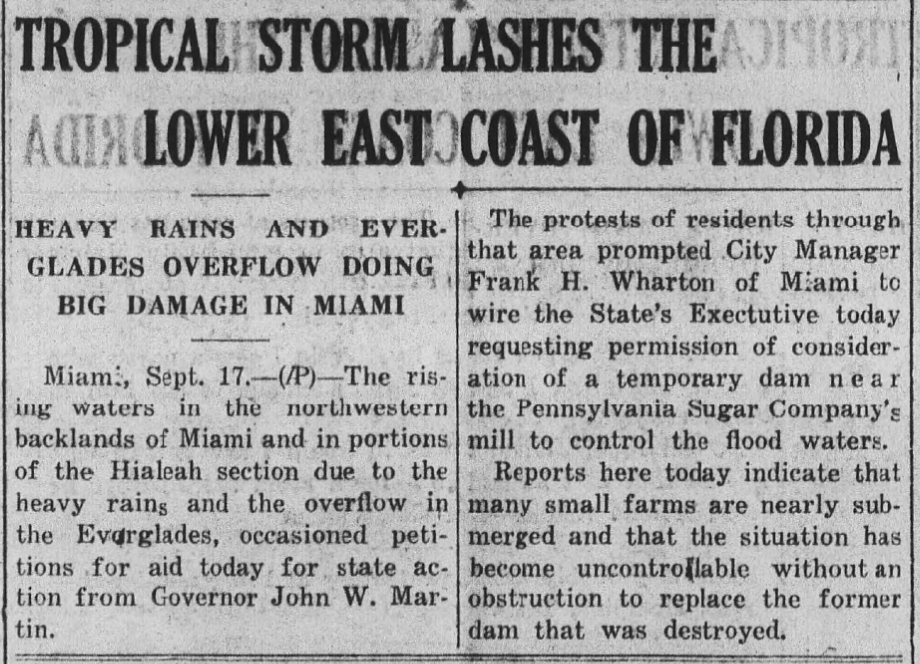
A contemporary wire report described nearly submerged small farms in northwest Miami and Hialeah and requests for state action.
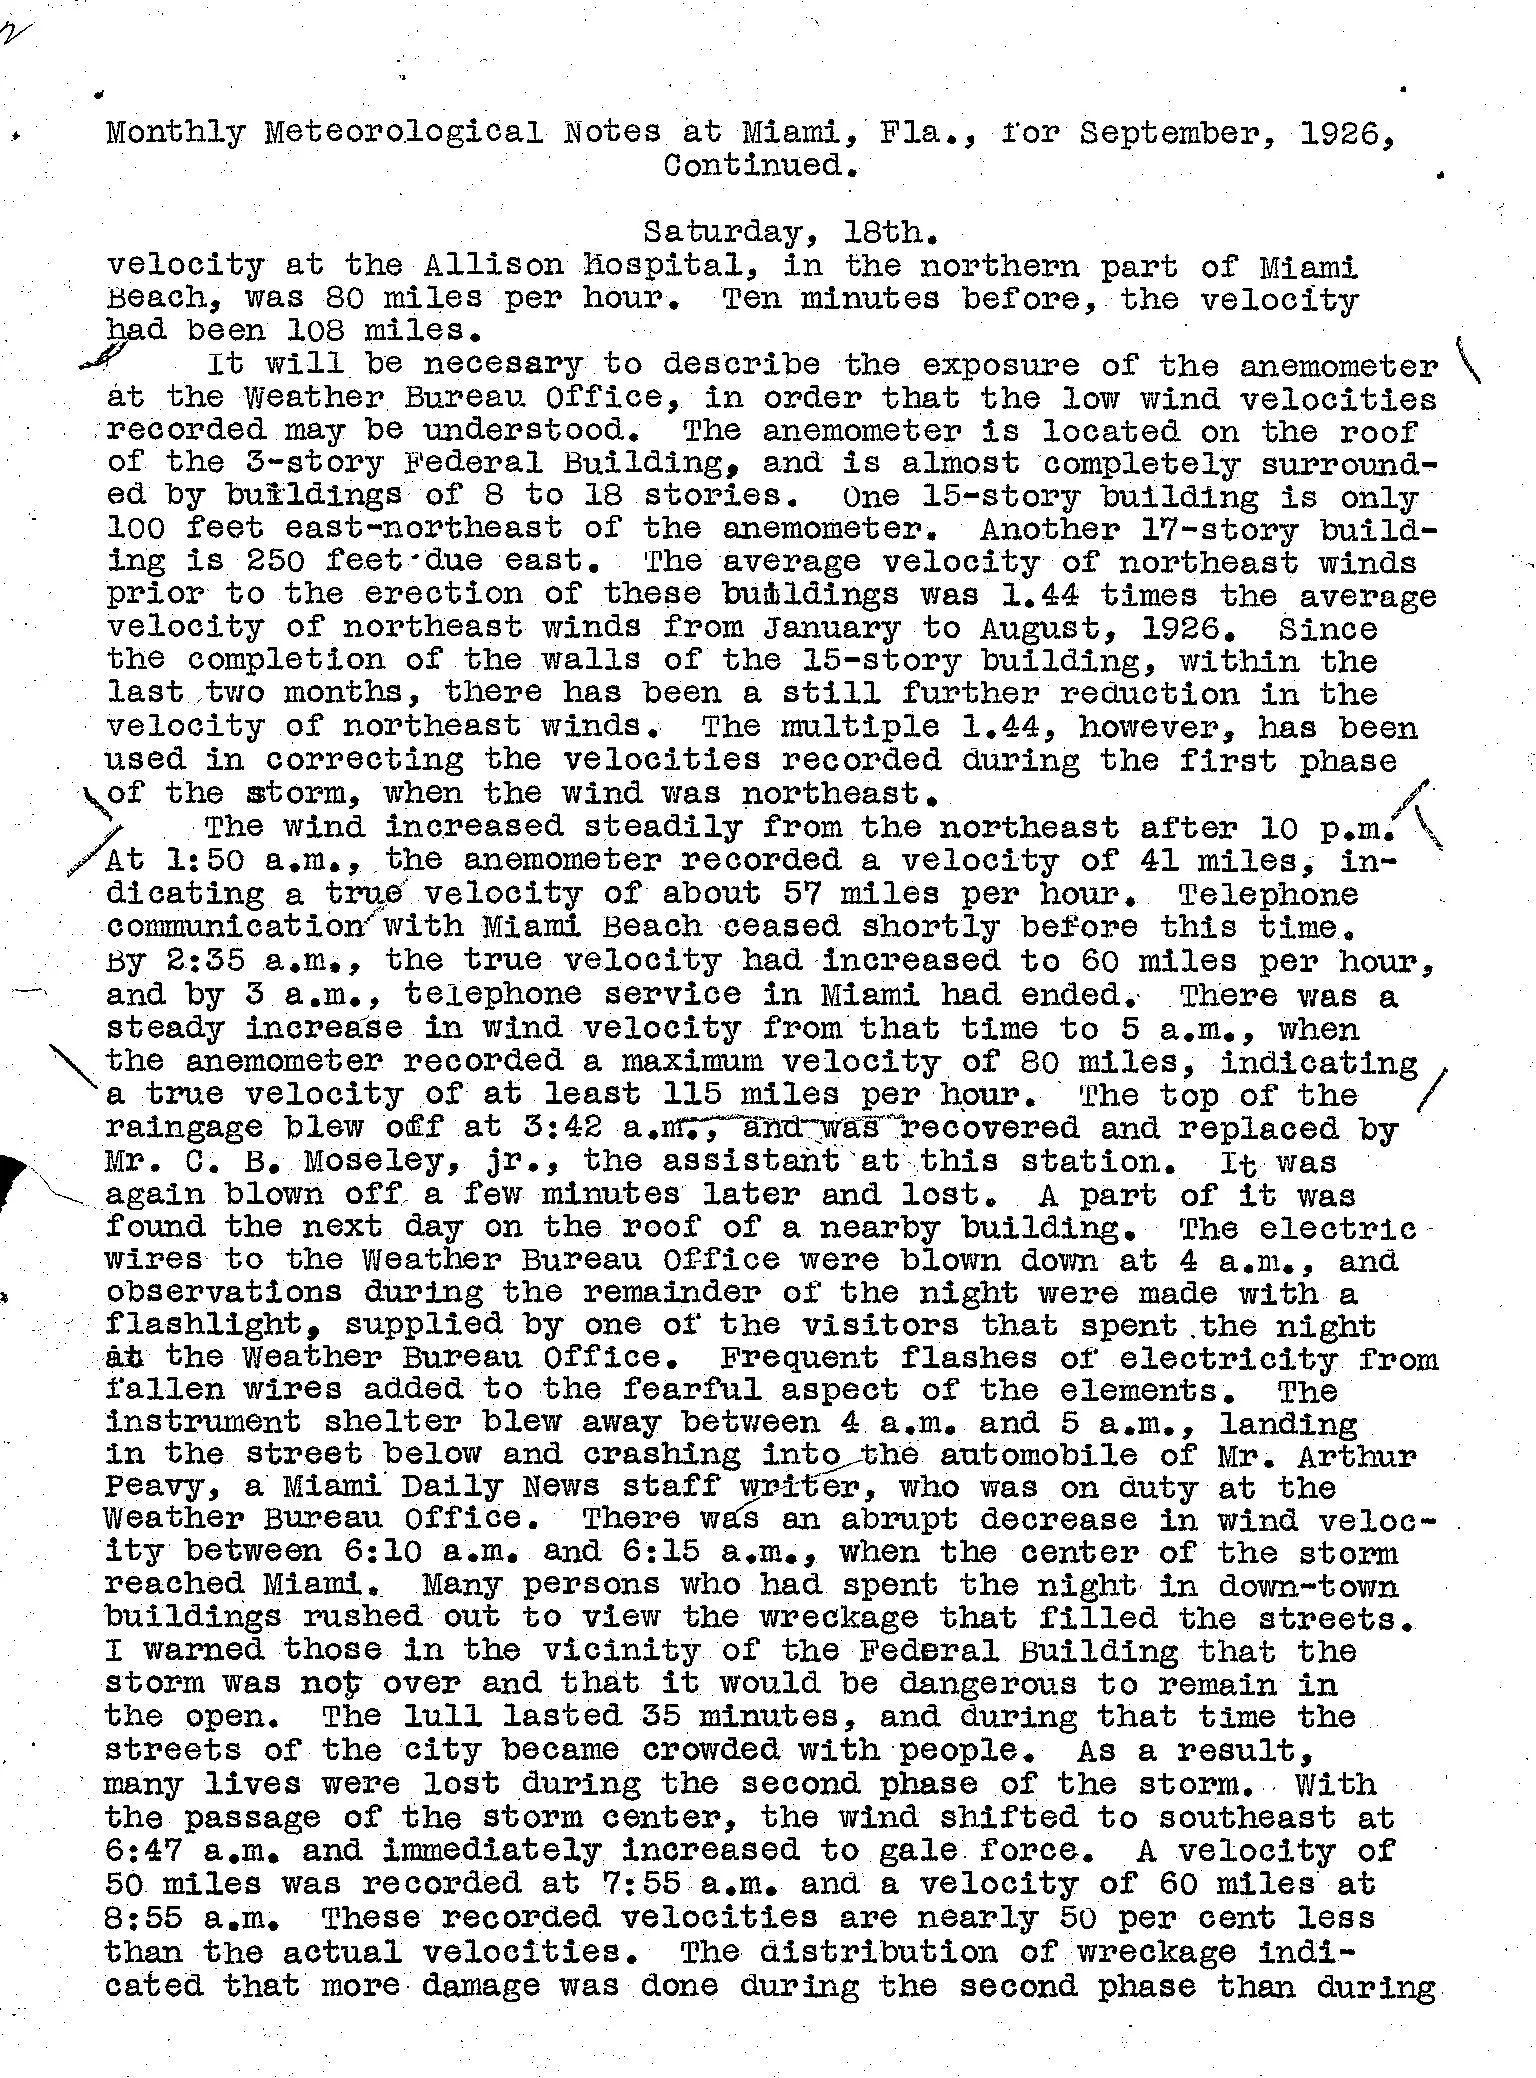
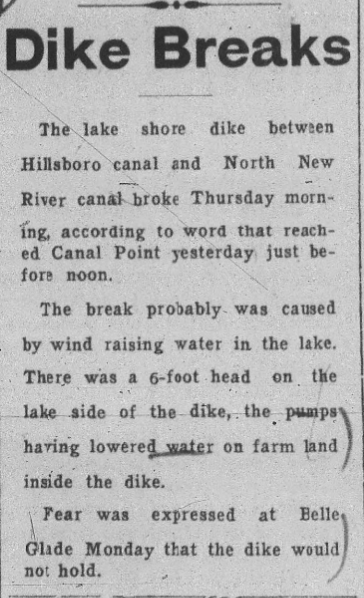
What can be proved: the cyclone track and intensity come from NOAA’s official HURDAT reanalysis; the 1.20-inch burst comes from Gray’s original Miami meteorological notes. The supplied newspaper clippings add Hialeah, Everglades and Broward-area flood reporting, but the surviving crops do not include newspaper titles or page numbers, so they are shown as research clippings rather than fully cataloged citations.
Watch the instruments fail as the pressure collapses.
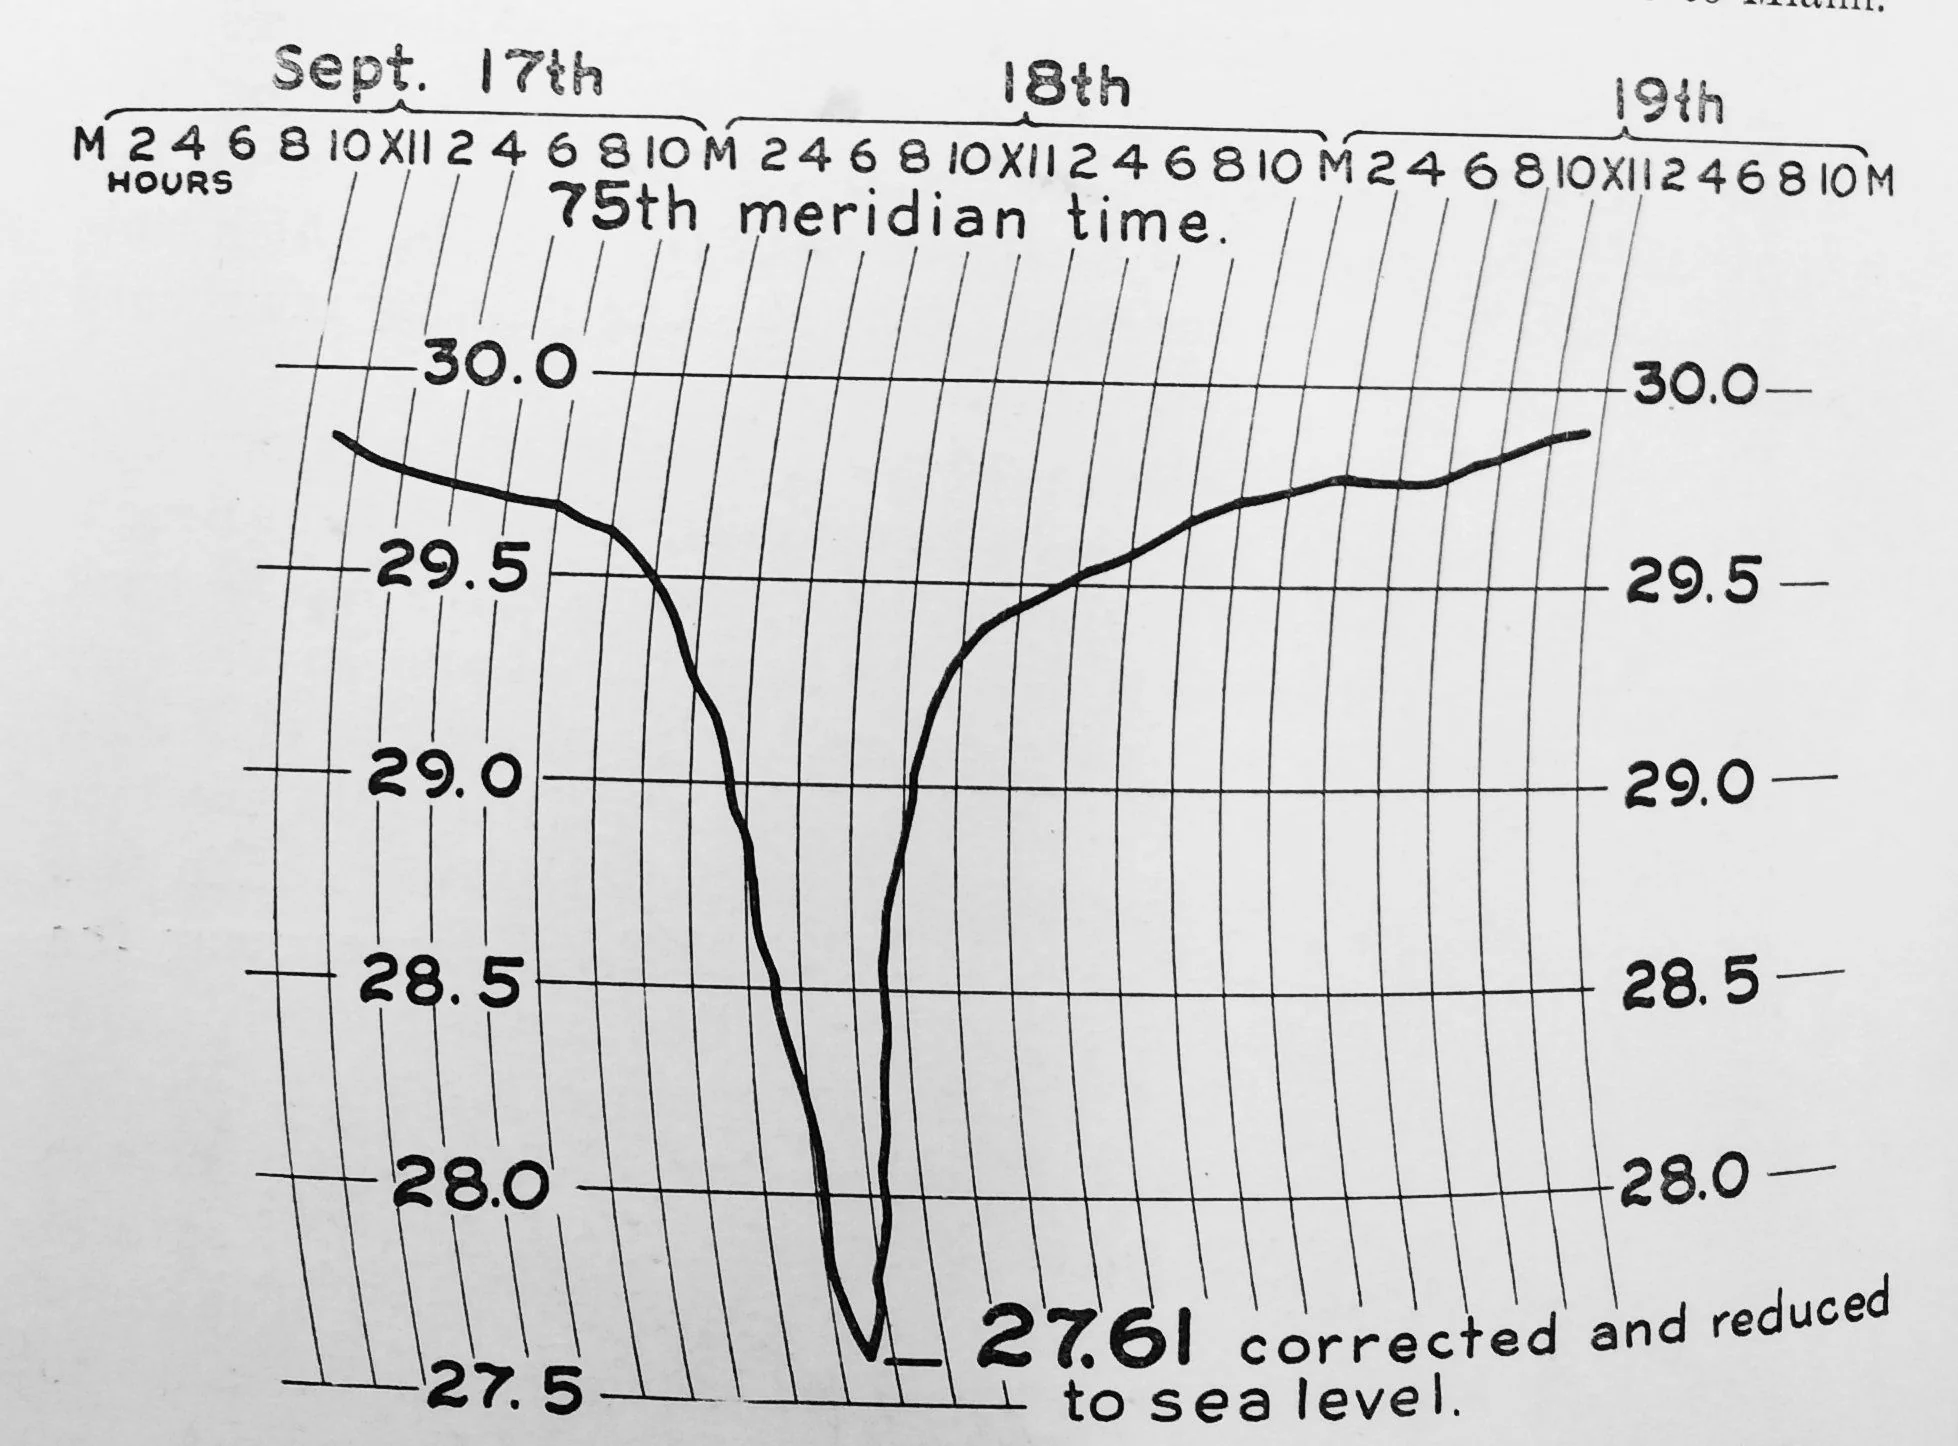
Every recoverable timed observation in one table
Download the observation ledger as CSV
| Local time | Pressure | Wind | Weather / station status | Evidence status |
|---|---|---|---|---|
| Sep. 17, 12 a.m.–10 a.m. | No hourly values stated | No hourly values stated | No unusual conditions noted; steady pressure fall begins at 10 a.m. | Narrative |
| Sep. 17, noon | — | — | Storm warnings authorized for Miami. | Warning record |
| Sep. 17, 8 p.m. | Falling moderately | 19 mph | Conditions had not yet signaled the violence to follow. | Measured |
| Sep. 17, 10–11 p.m. | Rapid fall begins at 10 p.m. | Increasing from northeast | Hurricane warnings hoisted about 11 p.m. | Measured + action |
| Sep. 18, midnight | 0.11 in. fall since 10 p.m. | Fresh gale | Heavy rain begins after midnight. | Measured |
| 1:50 a.m. | Falling | 41 mph recorded; about 57 mph corrected | Miami Beach telephone service already ending. | Measured + corrected |
| 2:35 a.m. | Falling | About 60 mph true velocity | Conditions worsening steadily. | Corrected estimate |
| 3:00–3:42 a.m. | Falling | Increasing | Miami telephone service ends at 3; rain-gauge top blows off at 3:42 and is lost minutes later. | Instrument failure |
| 4:00–5:00 a.m. | Falling rapidly | 80 mph recorded at 5; at least 115 mph corrected | Power lines down; observations by flashlight; instrument shelter blows away. | Measured + corrected |
| 5:30–6:10 a.m. | 0.40 in. fall in 40 minutes | Violent, then abrupt decrease | Pressure nearly stationary for 15–20 minutes after the plunge. | Measured change |
| 6:10–6:30 a.m. | Near minimum | Falls to 10 mph downtown at 6:30 | Eye lull begins downtown; Allison Hospital still reads 80 mph. | Two stations |
| 6:45–6:47 a.m. | 27.61 in. sea-level mercurial minimum; 27.54 in. barograph | Shifts southeast and immediately reaches gale force | Center passes; lull ends. | Measured minimum |
| 7:30–8:12 a.m. | Rising rapidly | Allison Hospital 128 mph at 7:30; instrument lost at 8:12 while recording 120 mph | Gray estimated an extreme of 140–150 mph at Miami Beach. | Separate station |
| 7:55–8:55 a.m. | Rising rapidly | 50 then 60 mph recorded downtown | Gray said sheltered readings were nearly 50% below actual velocity. | Measured, sheltered |
| 9:00 a.m.–6:00 p.m. | 29.30 in. by noon | Shifts southwest at 9 a.m.; steadily diminishes | Second phase recedes through afternoon. | Measured + narrative |
Rainfall limit: Gray described heavy, wind-driven rain after midnight, but the downtown gauge failed at 3:42 a.m. and was then lost. The surviving narrative therefore cannot support a complete storm-total rainfall value for this office. Any later daily total must be checked against the original climatological form and flagged for gauge exposure or missing accumulation.
The animation remains tied to the original pages.